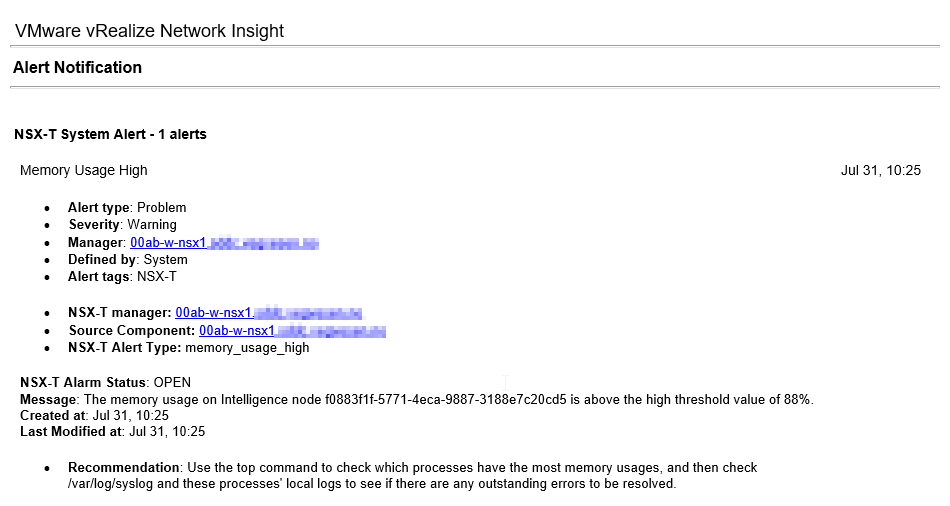
Throughout the summer I’ve received several high memory threshold alerts for NSX Intelligence in one of my customers environment. The alert was in form of an email from vRNI that got the alert from NSX-T.
The memory usage on Intelligence node <uuid> is above the high threshold value of 88%
I created a case with VMware support and got a workaround that tunes down the memory and number of threads for the druid service, while also tweaking the alert itself. And here is how:
- Consider taking a snapshot first.
- Tune the configuration (we make a backup of the config files first just in case)
cp /opt/druid/conf/druid/broker/jvm.config ~/jvm.config.bak
vi /opt/druid/conf/druid/broker/jvm.config
# Change this
-XX:MaxDirectMemorySize=5632M -> 3072M

cp /opt/druid/conf/druid/broker/runtime.properties ~/runtime.properties.bak
vi /opt/druid/conf/druid/broker/runtime.properties

# Change this
druid.processing.numThreads=6 --> 1- Reboot the NSX Intelligence.
- In NSX-T, tweak the NSX Intelligence alert thresholds for “Memory Usage High” og “Memory Usage Very High“. Tip: you can filter on “
intelligence” .NSX-T > Alarms > Alarm Definitions

- Monitor the startup of NSX Intelligence. It should start up without any alarms.
NSX-T > System > Appliances- One time we got 2 alerts about services not starting. We started them manually from NSX Intelligence CLI (login as admin) with ‘
start service <service-name>‘ - You can get service status with ‘
get services‘
- One time we got 2 alerts about services not starting. We started them manually from NSX Intelligence CLI (login as admin) with ‘
